
Post: Google Summer of Code 2022 - CERN-HSF
GSoC 2022 CERN-HSF
Optimization of GPU Tracking Pipeline for ACTS GPU R&D
This post discusses my experiences, learnings and achieved results over the past 4 months as a contributor to ACTS under CERN. Relavant links to code and benchmarks are provided along the way.
Link to all benchmarking code : latest branch
Link to kernel benchmarking code : kernel benchmark branch
note : vecmem contiguous memory resource reset function is not available hence if required to run for many events it is required to initialize contiguous memory resource with a large memory (>~4GB)
Introduction
Acts is a track reconstruction software toolkit for high energy physics experiments. With the potentially increased number of particle interactions in the High Luminosity Large Hadron Collider (HL-LHC) experiments in the future track reconstruction time will also increase. Therefore, Acts GPU R&D (Research and Development) is conducted under traccc, vecmem and detray to accelerate the track reconstruction time. Vecmem provides memory management tools for convenient GPU memory management and caching allocators, Detray is a geometry builder which translates the CPU geometry into GPU one (did not get my head around this one yet.) and finally Traccc demonstrates the GPU tracking pipeline.
My focus is on improving the throughput of the Traccc pipeline and bench-marking the results. This is achieved by using caching allocators provided by Vecmem and CUDA-MPS or CUDA-MIG which are two ways to improve concurrent GPU utilization.
Lets understand the use case briefly
Particles colliding at very high speeds break up into other (smaller) particles and are projected outwards. These projected particles hit very sensitive detector planes, these interactions between the particles and the detection planes (known as cells) are recorded and ultimately used to generate the particle track. In reality many such particles are produced and they may interact with each (like a chain reaction) producing a very large number of events. Therefore improving the throughput (events/time) is important for algorithms.
How can CUDA Multi-Process Service (MPS) Improve Throughput?
Nvidia documentation explains this a lot clearly than I can, but let me provide the necessary information briefly.
Nvidia uses concurrent scheduling, which means gets scheduled at the same time if possible, to schedule kernels from work queues of the same process (same CUDA context). However, it uses time sliced scheduling to schedule kernels from multiple processes (different CUDA contexts). Therefore multiple processes cannot utilize the GPU simultaneously.
To put it in simple terms (maybe slightly inaccurate though 😉), the multi-process server acts as a middle man receiving kernels from multiple processes and submitting these kernels to the GPU as if it were from the same CUDA context.
Imagine a program occupying just 10% of your GPU’s resources, theoretically you can run 10 such processes on your GPU simultaneously with MPS to occupy ~100% of your GPU. This is the main advantage of using MPS.
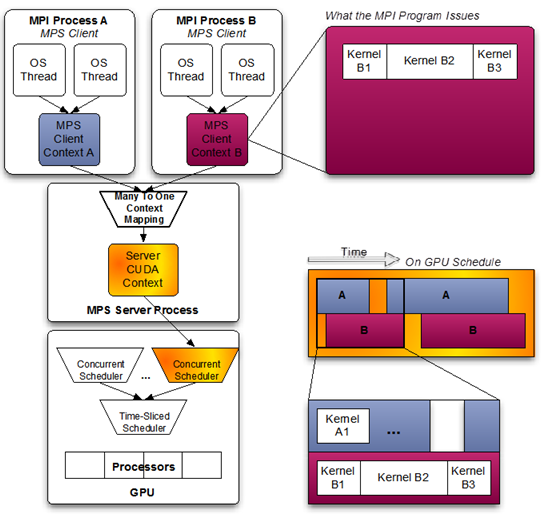
Good to know about Nvidia’s HyperQ (available on post Kepler architectures) which allows submitting GPU kernels to the GPU simultaneously. Imagine a single lane highway from the host to device versus a 32 lane highway (here highways meaning workload queues).
MPS documentation : https://docs.nvidia.com/deploy/mps/index.html
Traccc Pipeline
This entire pipeline can be broken down into sub components as follows
Clusterization - grouping cells that are adjacent to each other. Measurement Creation - calculates the weighted averages of each cluster positions. Spacepoint Formation - converts these measurement’s positions from local. to global space Seeding - finds out a set of 3 spacepoints that belong to the same bin. Track parameter estimation - does global to local transform.
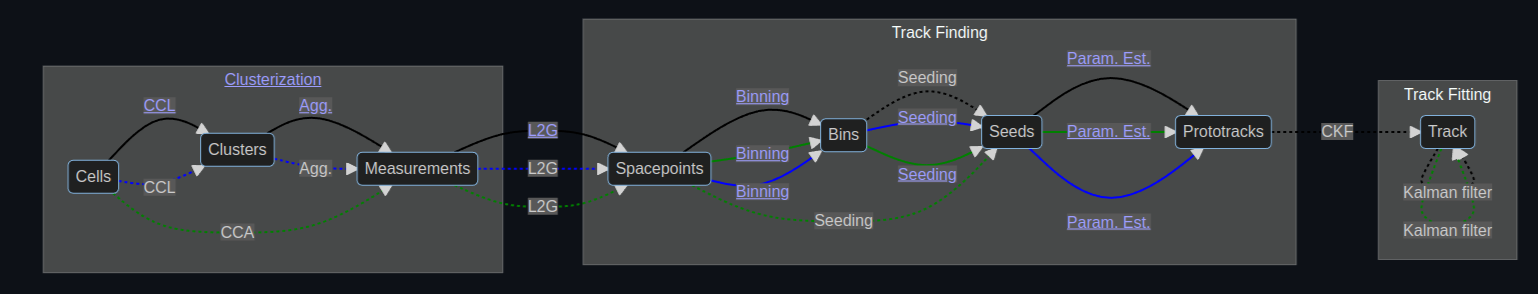
Definitions that will be helpful to understand the pipeline
Cells - are particle interactions on the detector plane. It contains information about the local position on the detector plane. A single particle interaction produces multiple cells. Clusters - are a group of cells that are adjacent to each other in the detector plane. Measurements - are weighted averaged local positions of the cells in a cluster. Spacepoints - are local positions of measurements transformed onto global positions. This will be in input to the seeding algorithm. Binning - groups spacepoints to a 2D grid. A bin is a section of detector geometry which contains a number of spacepoints. Seeds - are a set of three spacepoints may belong in the same or adjacent bins and might be produced by the same particle. Prototracks - produced by track parameter estimation is a global to local transformation on the surface. Track - is the set of all spacepoints produced by the same particle.
My First Contribution
As of June of 2022 CUDA clusterization component of the Traccc pipeline was not completed. Porting the SYCL cluterization to CUDA was my first step. The first PR was not merged in as it was soon outdated by a structural change. PR 206 this was more of a learning experience for me. Afterwards another PR, PR 209 was created and it was merged in. This completes the Traccc pipeline until Kalman filtering.
Okay.. so how does MPS help Traccc?
Generally a single instance of Traccc computes several events sequentially and each event undergoes pipeline shown in Figure-01. Shown below is how multiple processes would execute 10 events each.
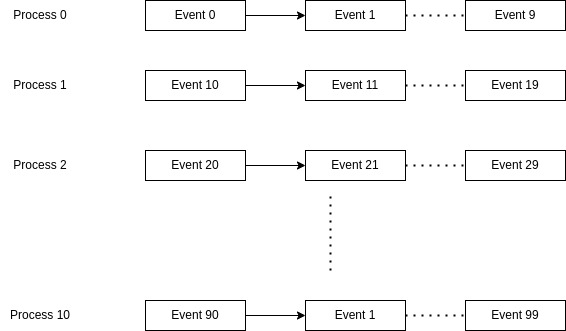
The algorithms in the Traccc pipeline are parallelized using CUDA and each event do not fully occupy the GPU resources. Moreover, collision events are independent to each other, hence multiple processes can run simultaneously on different event data improving the overall throughput.
Challenge
However obtaining a higher throughput just by using CUDA-MPS is not easy as it seems. In a recent version of Traccc the timings for one event are as follows,
$ build/bin/traccc_seq_example_cuda --detector_file=tml_detector/trackml-detector.csv --digitization_config_file=tml_detector/default-geometric-config-generic.json --cell_directory=tml_full/ttbar_mu200/ --events=1 --run_cpu=0 --input-binary
Running build/bin/traccc_seq_example_cuda tml_detector/trackml-detector.csv tml_full/ttbar_mu200/ 1
==> Statistics ...
- read    92504 spacepoints from 13565 modules
- created        321488 cells
- created        92504 meaurements
- created        92504 spacepoints
- created (cpu)  0 seeds
- created (cuda) 15424 seeds
==> Elpased time ...
wall time           0.681589
file reading (cpu)        0.0591937
clusterization_time (cpu) 0.0182984
spacepoint_formation_time (cpu) 0.00120419
clusterization and sp formation (cuda) 0.0172306
seeding_time (cpu)        4.544e-06
seeding_time (cuda)       0.0521068
tr_par_esti_time (cpu)    7.4e-08
tr_par_esti_time (cuda)   0.0018714
Roughly kernel execution times sum up to 70 ms (excluding data copies), which is only a small fraction of the wall time. Therefore it is not realistic to expect a major increase in throughput by running processes simultaneously. which is why reducing sequentially running and data copies is essential to achieve a better effect by using MPS.
Vecmem Caching Allocators
Vecmem provides convinient GPU memory allocation. There are several upstream memory resources derived from C++ Polymorphic Memory Resource (PMR) and downstream memory resources (caching allocators). For example using the managed_memory_resource upstream resource we can allocate unified memory (calls cudaMallocManaged). Given that each Traccc instance iterates over several events sequentially, memory needs to be allocated several times from the upstream resource, and it takes up a lot of time. This is an expensive operation, major improvements can be obtained if we could eliminate this, (see results with using contiguous memory resource).
This can be eliminated by the usage of Vecmem caching allocators. How it achieves this is by reusing the previously allocated memory. There are 2 such caching allocators that were tested as candidates. Contiguous memory resource and Binary Page memory resource.
For instance the contiguous memory resource allocates a block of memory of fixed size (hard coded) and it will be de-allocated only when the program ends, hence this is not scalable. Due to these two reasons it was initially decided that binary page memory resource will be the better option, but testing binary page memory resource resulted in much worse timings than without a caching allocator 😢 . The table below compares binary page memory resource, contiguous memory resource downstreams and CUDA pinned memory with device memory upstream. All the times are in seconds.
| Component | CPU | CUDA (pinned mem) | Binary page | Contiguous |
|---|---|---|---|---|
| File I/O | 0.0637 | 0.671 | 2.522 | 0.0529 |
| Clusterization | 0.1818 | 0.137 | 0.0922 | 0.0853 |
| Seeding | 1.849 | 0.1557 | 0.1448 | 0.100 |
| Tr_param_est | 0.0327 | 0.01396 | 0.0109 | 0.00820 |
Contiguous memory resource has better performance. However, to use contiguous memory resource for hundreds of events would require a large amount of memory to the allocated initially and still there is a possibility of us running out of allocated memory if we decide to iterate over more events. As a proof of concept a minor change to contiguous memory resource was made by me. Before any further explanation I should say that this is more like a hack to get things working for the benchmarking use case and would be further developed by the vecmem developers in the future.
Change done to Contiguous Memory
It is a really naive solution to reset the memory utilized by the previous event. The next free pointer (m_next) is set to the beginning pointer of the memory blob (m_begin) after every event. This will enable overwriting memory utilized by the previous event.
void contiguous_memory_resource::reuse(){m_next=_begin;}
Benefits of Using Contiguous Memory Resource
- Significantly reduces file I/O times
- This makes parellel computations a significant fraction of the wall time
- Hence, this will increase the effect of CUDA MPS
Method of benchmarking
All benchmarks shown here are done on the Hermes server at Lawrence Berkeley National Laboratory. It has a AMD EPYC 16 core processors and 16 hyper threads and two A30 GPUs.
Overall throughput
The procedure is simple, spawn n number of jobs concurrently while increasing n from 1 to N (maximum number of concurrently running processes). Log the time to complete all the concurrent jobs.
This script will iterate over n
#!/bin/bash

# run n cuda processes for example n in range 1 -> 32
# benchmark cuda mps for increments of 10 events per process for example i in range 1 -> 50
max_proc=2
max_events=150
increment=10
cores=1		# number of cores (sockets)
threads=1	# number of threads per core
gpu=1
path='../data'
log=0
log_path=""
while getopts l:c:t:p:e:g:d: flag;
do
    case "${flag}" in
	c) cores=${OPTARG};;
	t) threads=${OPTARG};;
	p) max_proc=${OPTARG};;
	e) max_events=${OPTARG};;
	g) gpu=${OPTARG};;
	d) path=${OPTARG};;
	l) log=${OPTARG};;
    esac
done
echo "logs : $log"
if [ $log != 0 ];then
	Tstart=$(date "+%s")
	mkdir ./kernel_logs_$Tstart/
fi
echo "$max_proc $max_events";
for((i=max_events;i<=max_events;i+=increment))
do
	echo "starting to benchmark with $i processes";
	for((j=1;j<=max_proc;j+=1))
	do
		echo "starting new run with $j events";
		if [ $log != 0 ];then

			mkdir -p ./kernel_logs_$Tstart/$i
			mkdir ./kernel_logs_$Tstart/$i/$j
			log_path="./kernel_logs_$Tstart/$i/$j"

			./benchmark_kernels.sh -p"$path" -n$j -e$i -c$cores -t$threads -g$gpu -l"$log_path"
		else
			./benchmark_cuda.sh -p"$path" -n$j -e$i -c$cores -t$threads -g$gpu
		fi

		sleep 1
	done
done
The following script will spawn seq_example_cuda.cpp n times in the background.
#!/bin/bash

num_proc=1 	# number of processes expected to run concurrently
events=1 	# number of event each process will compute
cores=1		# number of cores (sockets)
threads=1	# number of threads per core
datapath=""
numgpus=1
log_dir=""
while getopts n:e:c:t:p:g:l: flag;
do
    case "${flag}" in
        n) num_proc=${OPTARG};;
        e) events=${OPTARG};;
	c) cores=${OPTARG};;
	t) threads=${OPTARG};;
	p) datapath=${OPTARG};;
	g) numgpus=${OPTARG};;
	l) log_dir=${OPTARG};;
    esac
done
echo "$datapath"
echo "number of processes : $num_proc";
echo "number of events : $events";
echo "log path $log_dir"
export TRACCC_TEST_DATA_DIR=$datapath
Tstart=$(date "+%s.%3N")
for((i=0;i<num_proc;i++))
do
  # get processor id
	p=$((($i % ($cores * $threads))))
	echo " processor id $p";
	# get gpu id
	gpu_id=$(($i % $numgpus))
	echo " gpu $gpu_id";
	# end get gpu id
	if [ -z $log_dir ];then
	CUDA_VISIBLE_DEVICES=$gpu_id ../build/bin/traccc_seq_example_cuda --detector_file=tml_detector/trackml-detector.csv --digitization_config_file=tml_detector/default-geometric-config-generic.json --input_directory=tml_full/ttbar_mu200/  --events=$events --input-binary &
	fi
done
wait
Tend=$(date "+%s.%3N")
elapsed=$(echo "scale=3; $Tend - $Tstart" | bc)
# write the data to a csv file
python3 log_data.py $num_proc $events $elapsed $cores $threads cuda
echo "Elapsed: $elapsed s"
The following can be use instead to set the CPU affinity.
CUDA_VISIBLE_DEVICES=$gpu_id taskset -c $p ../build/bin/traccc_seq_example_cuda --detector_file=tml_detector/trackml-detector.csv --digitization_config_file=tml_detector/default-geometric-config-generic.json --input_directory=tml_full/ttbar_mu200/ --events=$events --input-binary &
However, there was an unexpected behaviour with using cpu affinity.
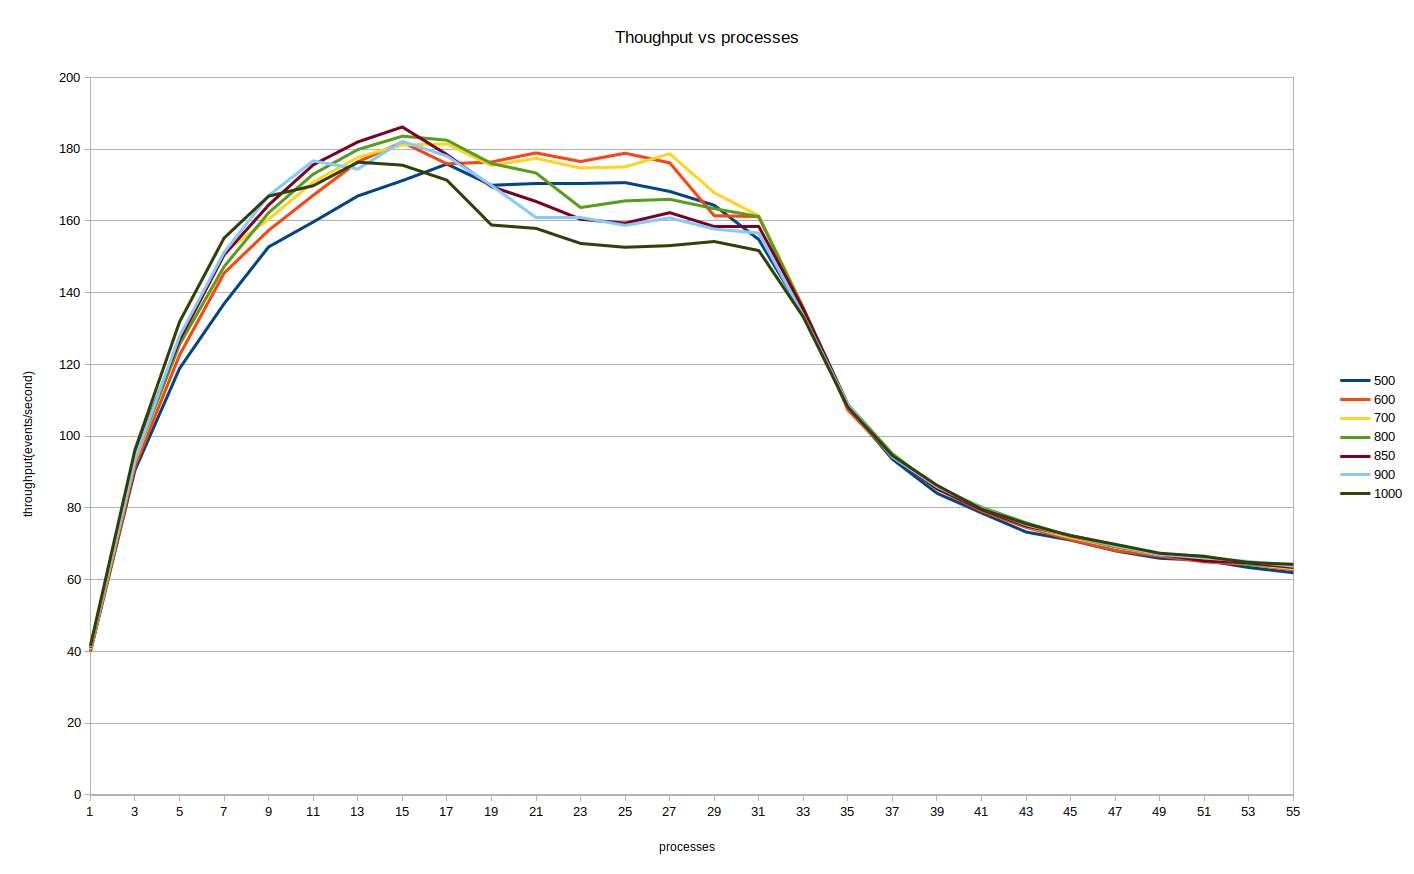
The throughput on the y axis measured in events per second and x axis correspond to the number of concurrently running processes. It’s evident that throughput falls after 32 concurrently running processes. This could be because CPU affinity blocks processes using other free processors, for example when one processor is blocked for IO, Linux scheduling would assign a process to it, but this behavior is blocked by setting CPU affinity. Hence benchmarks were conducted without CPU affinity. This plot also has several lines indicating how many number of events each process is computing and from this it can be deduced that 850 events per process seems to produce the peak throughput. Hence, 850 events are used per process for the following benchmarks as well.
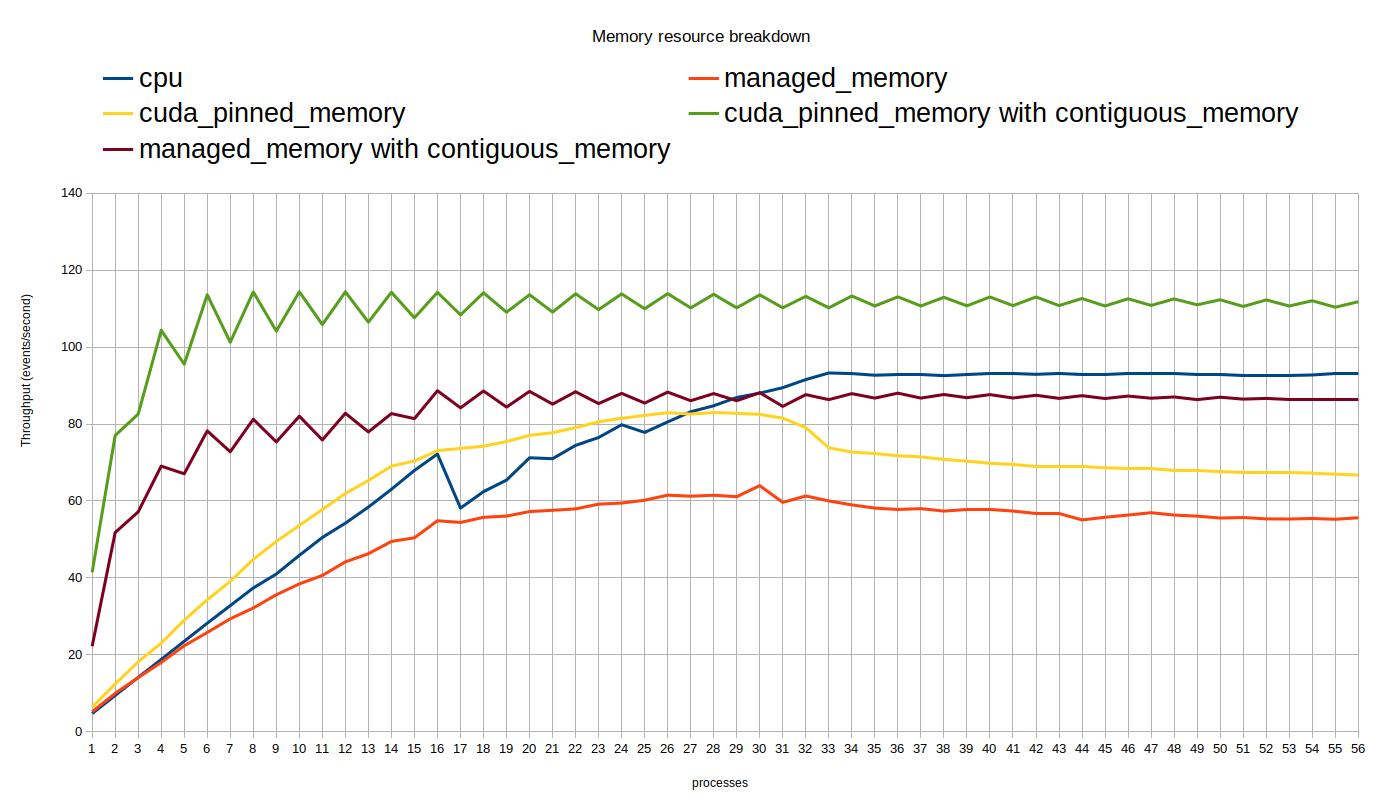
This plot show the throughput against number of concurrent processes and compares different memory resources each of which are computing 850 events. From this plot we can deduce that contiguous memory resource is the better option.
note : alternating spikes in the plot is because there are 2 GPUs
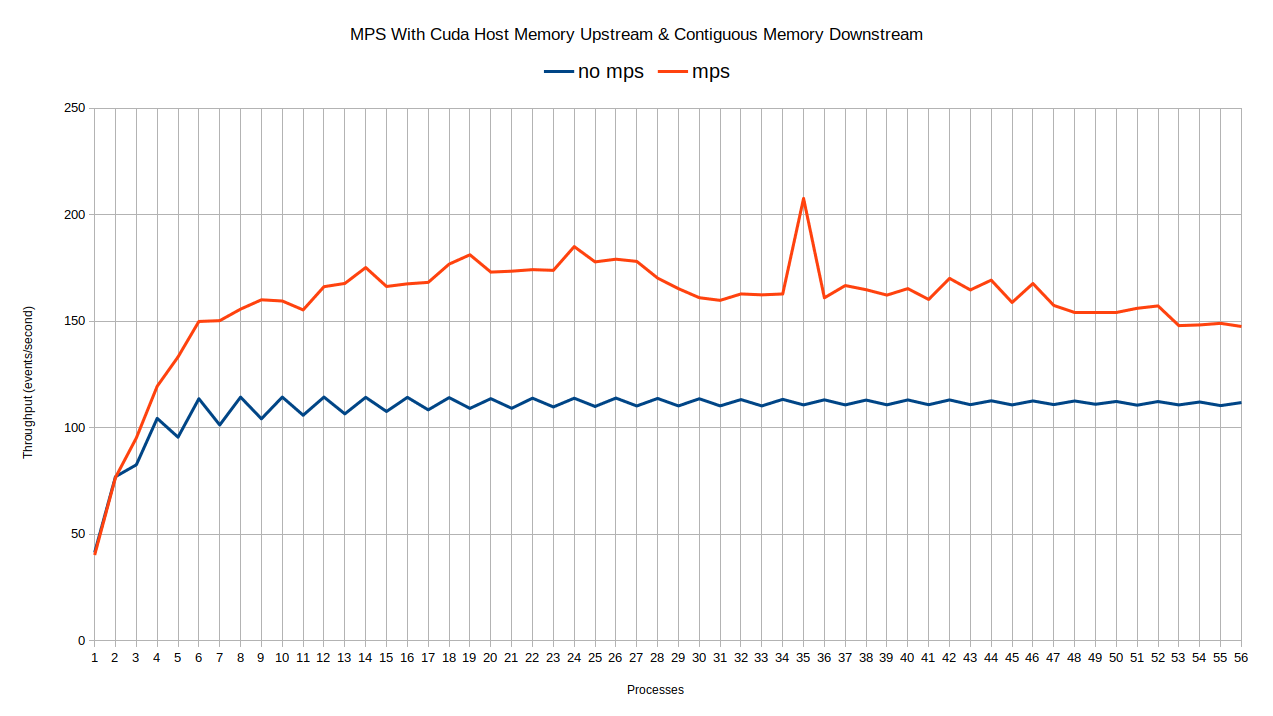
This plot shows a comparison of contiguous memory resource with cuda pinned memory upstream, with and without CUDA MPS. The improvement in throughput is significant compared to what I was able to obtain without using any caching allocator, this can be seen in my previous report (mid term report).
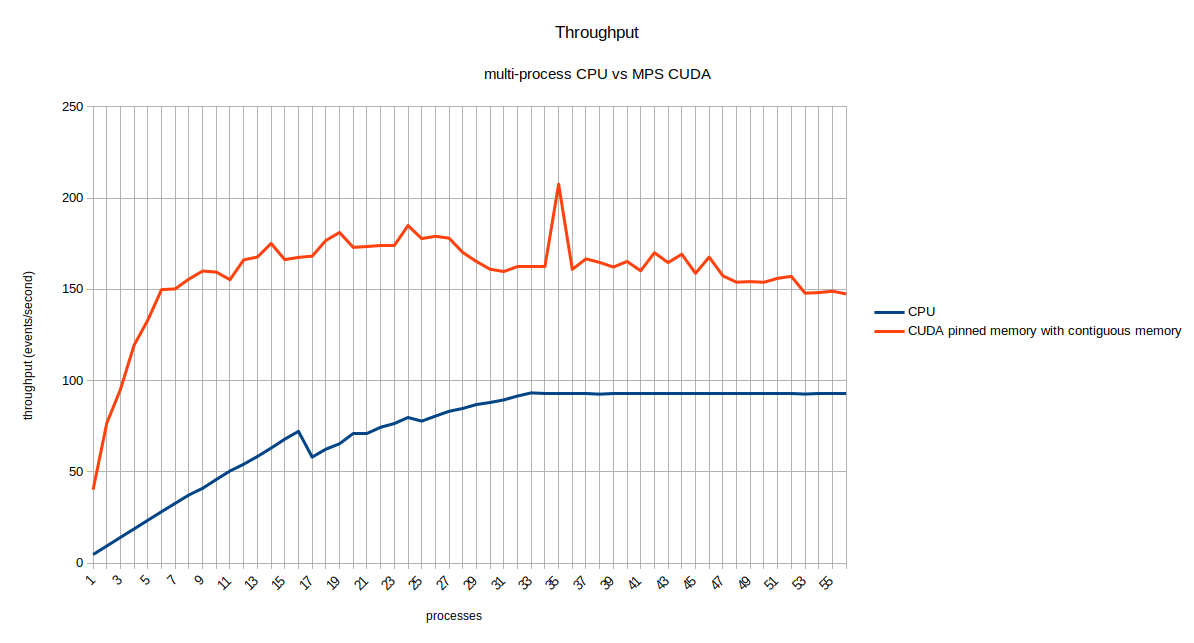
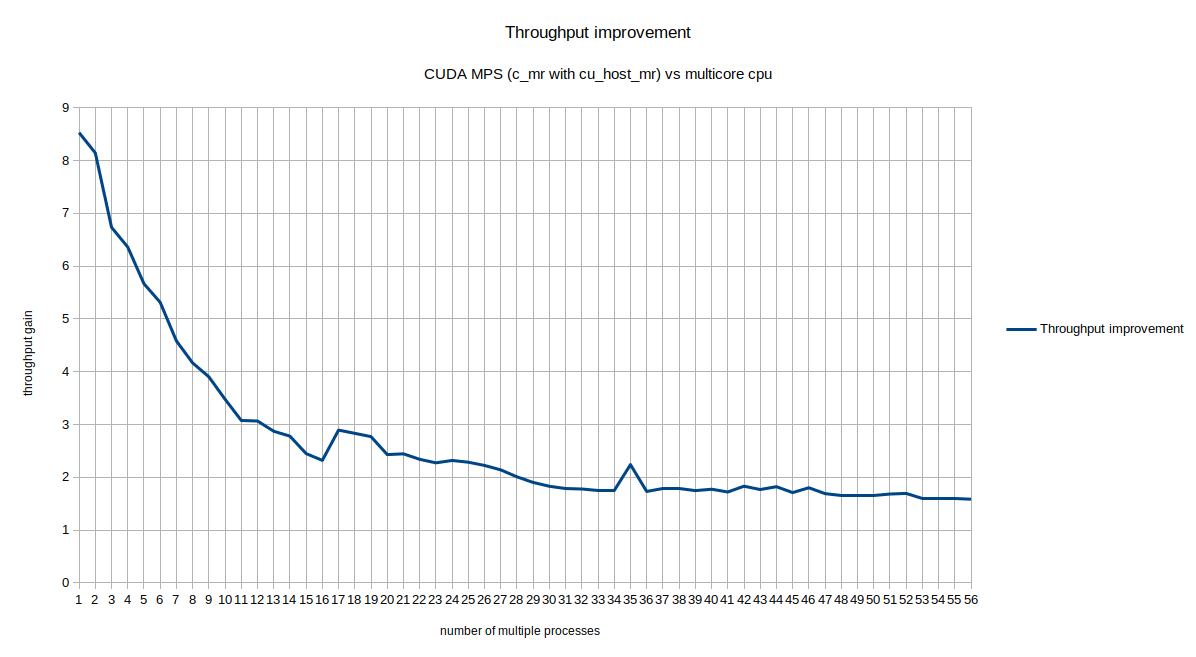
The above plots compare CUDA-MPS with contiguous memory resource results with the multi-core CPU processes.
Other benchmarks
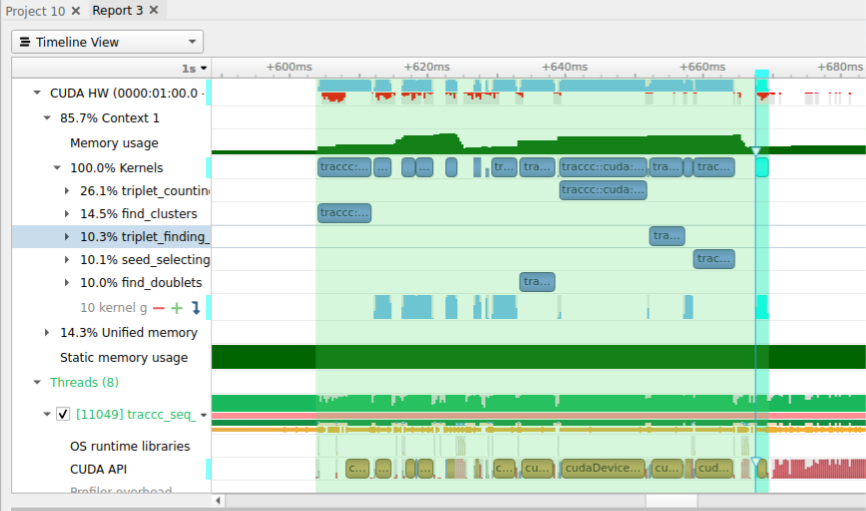
Kernel execution times
It was suggested by my mentor Charles Leggett that we time individual kernel execution times. Mainly to analyse how kernels execution times would be effected with and without mps when multiple kernels are running at the same time. Synchronizing each process before kernel execution was the tricky part. I decided to use shared memory library by Boost to achieve this. Below are some kernel benchamrks.
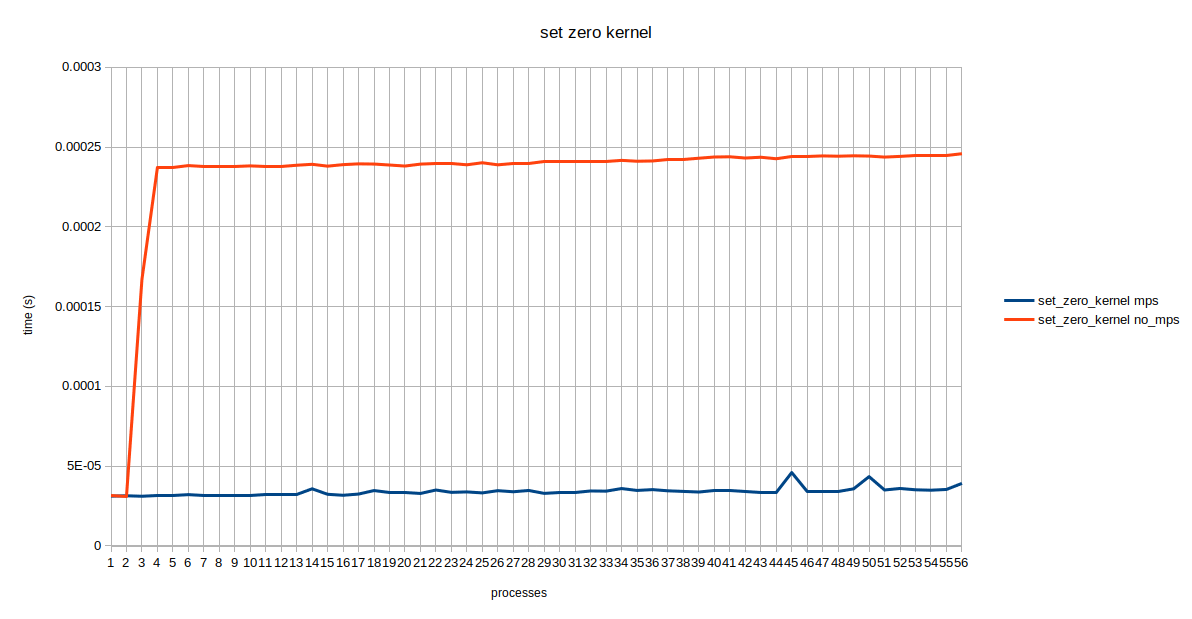
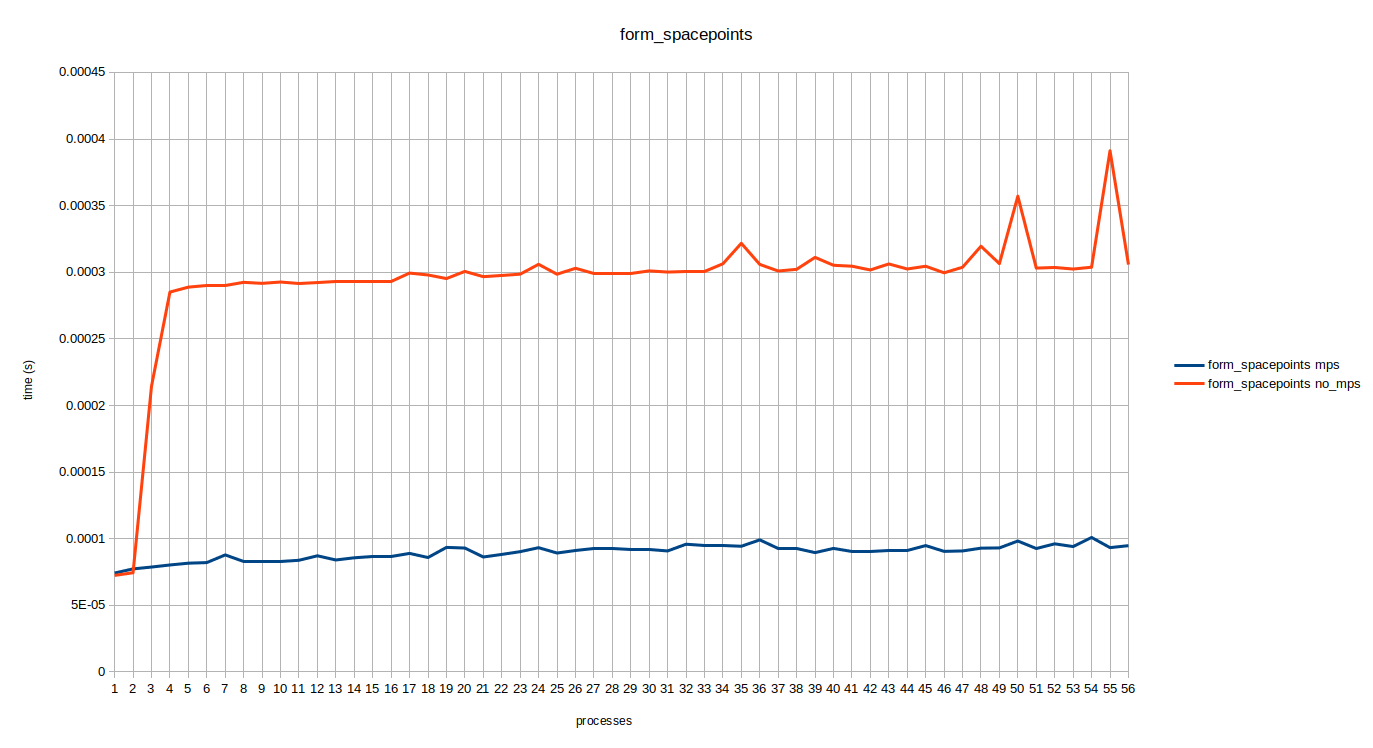
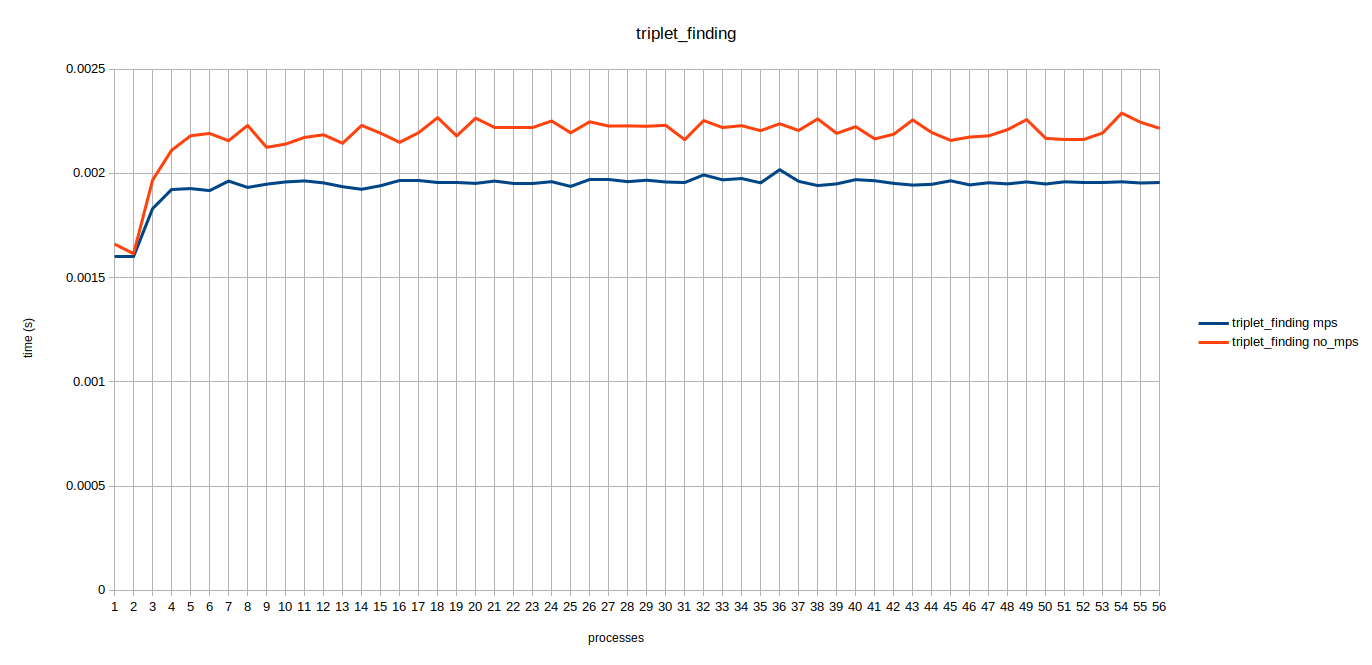
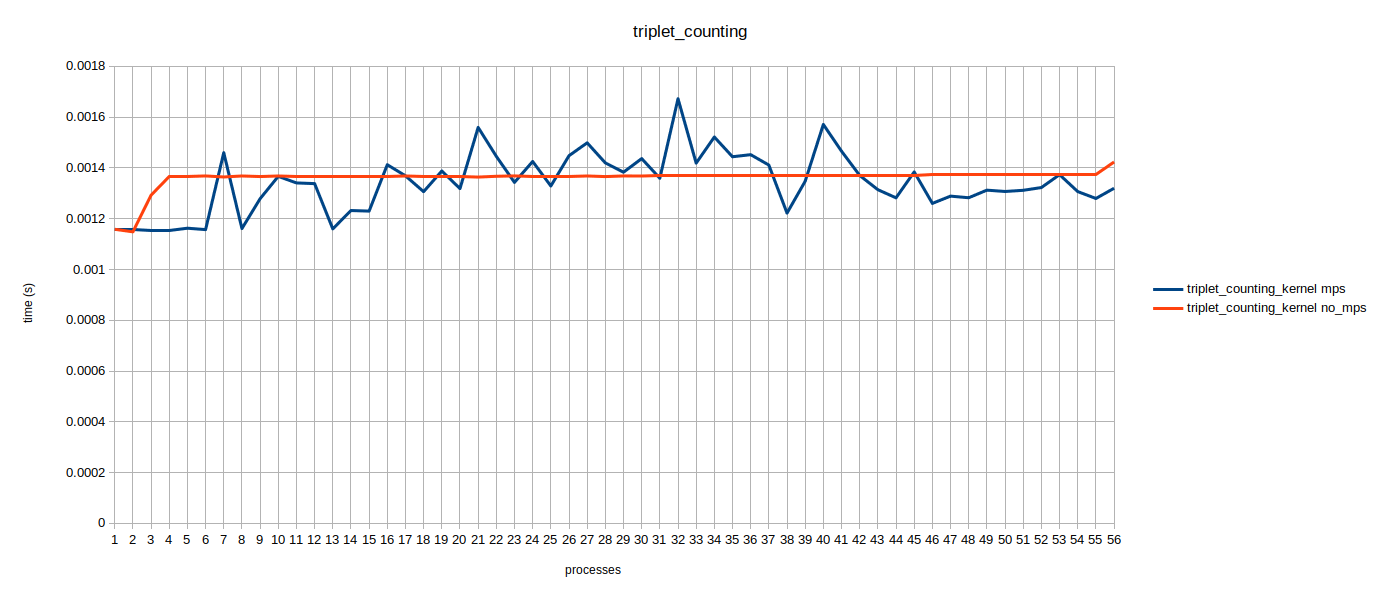
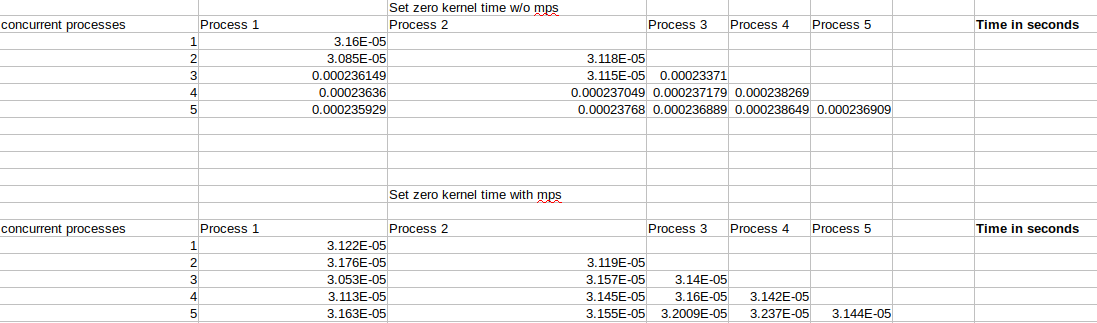
Here the times are averaged over all concurrently running processes. It can be seen that the execution times for 1 and 2 concurrent processes are almost the same, that’s because we are running processes on one of the two GPUs alternatively. A jump in kernel execution time for no MPS can be seen at 3 and 4 concurrent processes. Triplet Counting kernel is a special case which has a lot of threads therefore, it might fully occupy the gpu hence mps does not help much. If we look at the raw data it looks similar to the table below.
It was confusing as to why this 200us increase does not continue as the number of processes increase. I couldn’t interpret these results hence, my mentor consulted engineers at Nvidia and it was concluded that this 200us increment is a one time thing that occurs whenever there is a context switch.
All contributions and resources
- PR porting clusterization algorithms to CUDA
- PR porting clusterization algorithms to CUDA (outdated)
- Drive folder containing benchmarks
- Google doc containing weekly report
- Presentation done at ACTS parallelization group meeting
- Issues using in vecmem contiguous memory resource
- Issues using in vecmem binary page memory resource